Edit chart
Loading graph
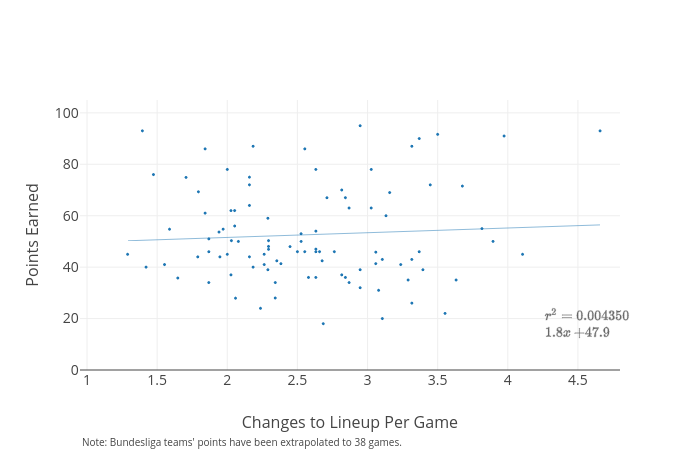
Ike348's interactive graph and data of "Points Earned vs Changes to Lineup Per Game" is a scatter chart, showing B; with Changes to Lineup Per Game in the x-axis and Points Earned in the y-axis.. The x-axis shows values from 0.95 to 4.8. The y-axis shows values from 0 to 105. This visualization has the following annotations: $r^2 = 0.004350\\1.8 x+47.9$; Note: Bundesliga teams' points have been extrapolated to 38 games.