Edit chart
Loading graph
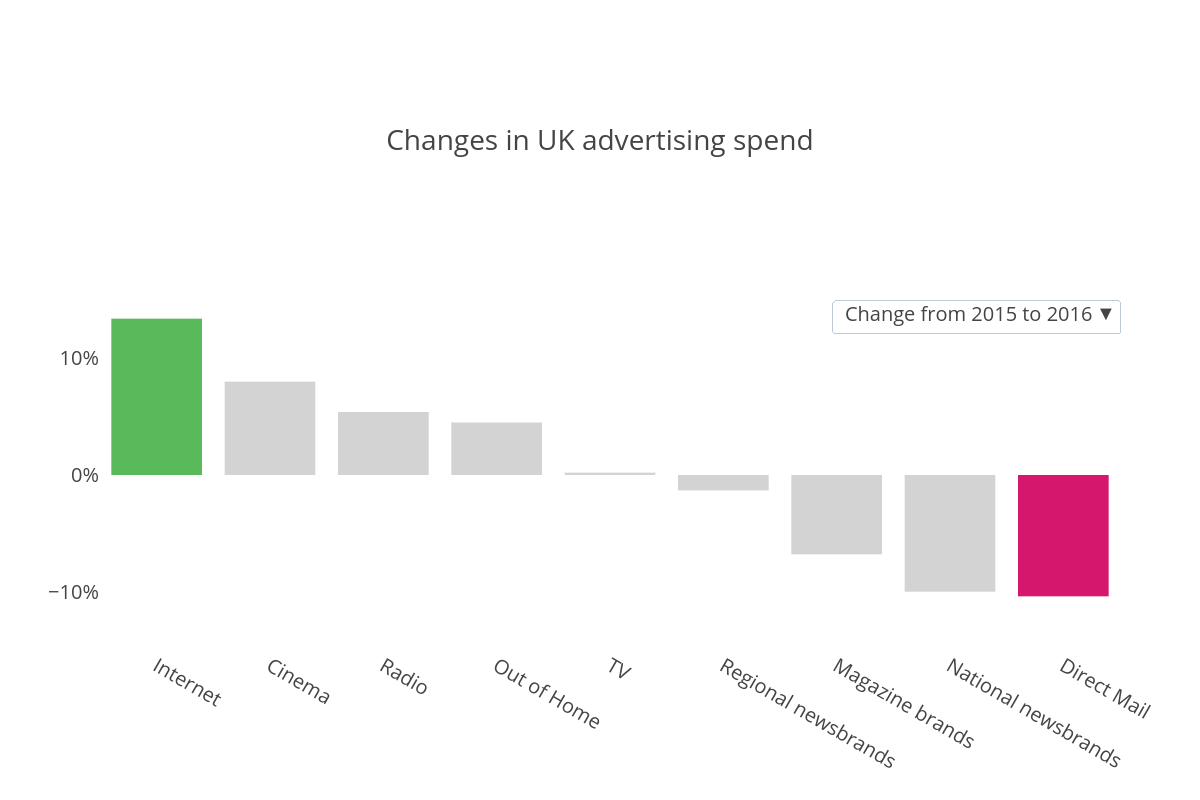
Indicia's interactive graph and data of "Changes in UK advertising spend" is a bar chart. The x-axis shows values from -0.5 to 8.5. The y-axis shows values from -0.15 to 0.15.