Edit chart
Loading graph
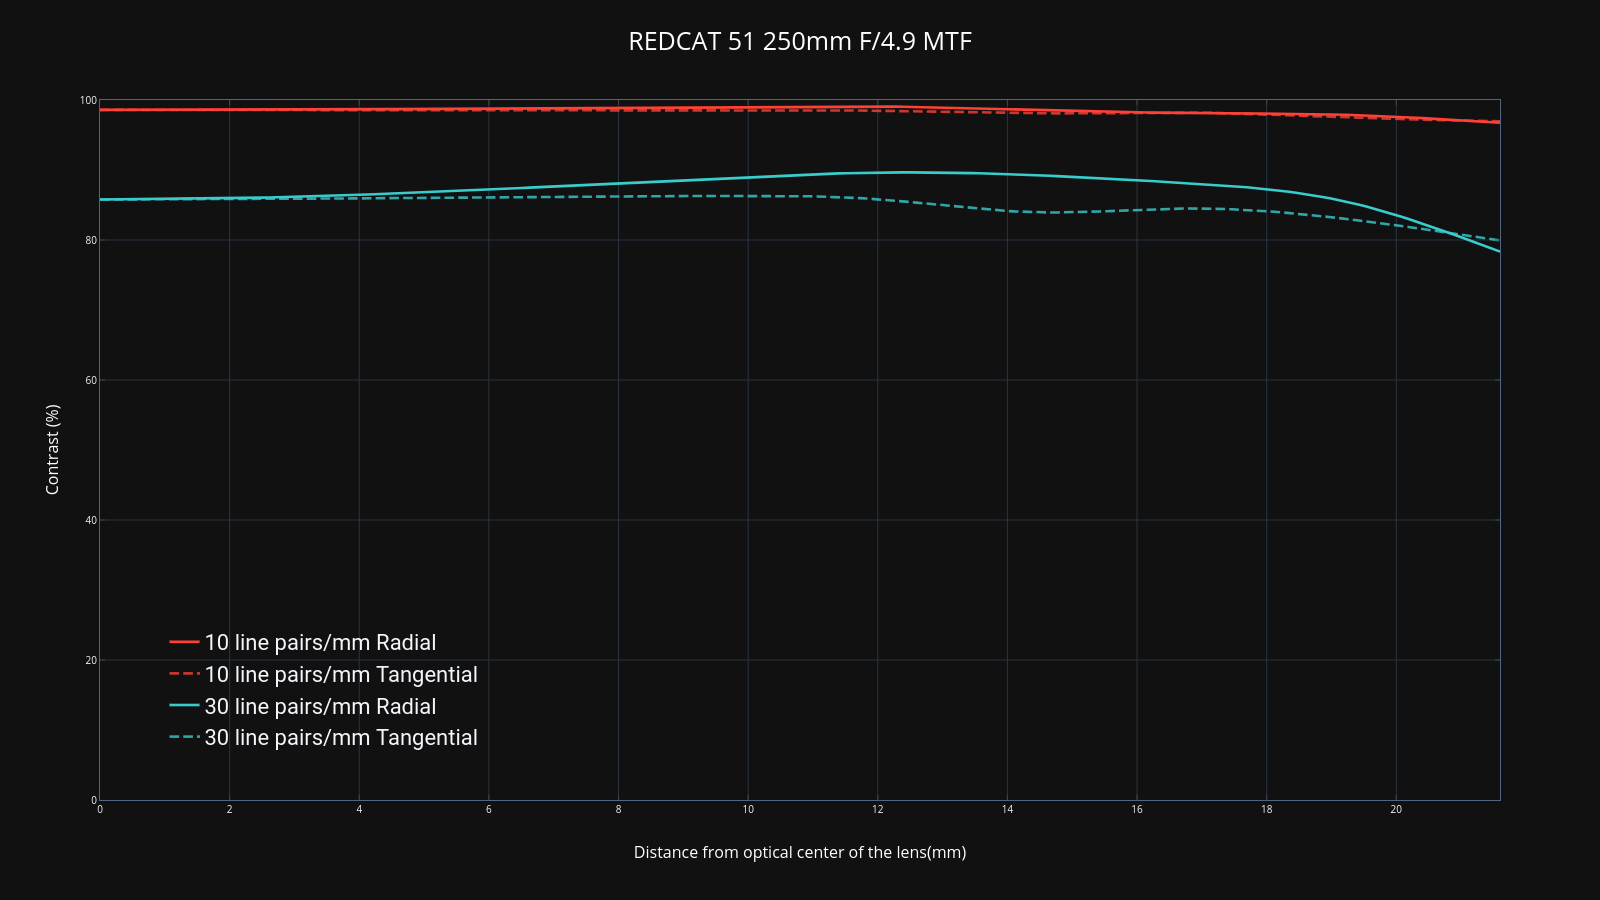
Jamesxc's interactive graph and data of "REDCAT 51 250mm F/4.9 MTF" is a line chart, showing 10 line pairs/mm Radial, 10 line pairs/mm Tangential, 30 line pairs/mm Radial, 30 line pairs/mm Tangential; with Distance from optical center of the lens(mm) in the x-axis and Contrast (%) in the y-axis.. The x-axis shows values from 0 to 21.6. The y-axis shows values from 0 to 100.