Edit chart
Loading graph
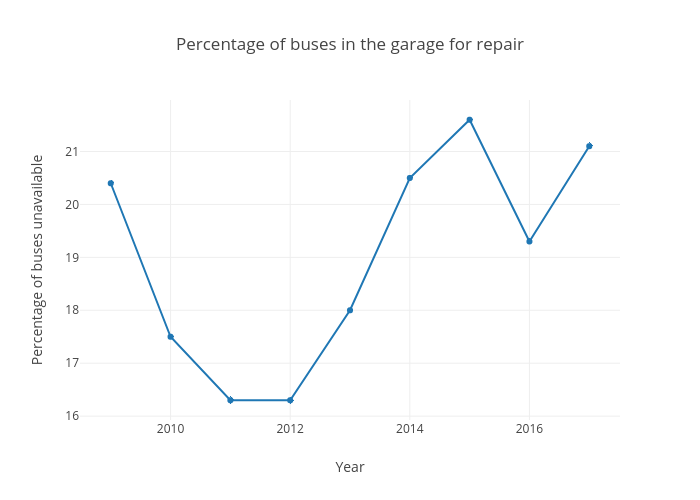
Jasonmagder's interactive graph and data of "Percentage of buses in the garage for repair" is a line chart, showing rate of repair; with Year in the x-axis and Percentage of buses unavailable in the y-axis.. The x-axis shows values from 2008.5293748036443 to 2017.4706251963557. The y-axis shows values from 15.96337153772684 to 21.936628462273163.