Edit chart
Loading graph
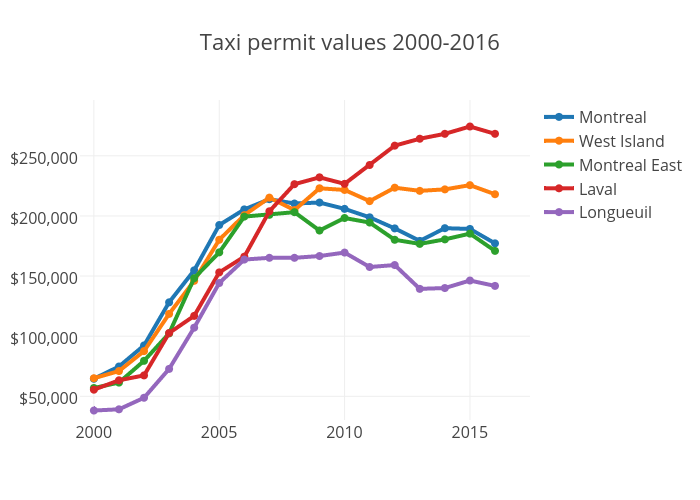
Jasonmagder's interactive graph and data of "Taxi permit values 2000-2016" is a scatter chart, showing Montreal, West Island, Montreal East, Laval, Longueuil. The x-axis shows values from 1999.445861112956 to 2017.3963225019816. The y-axis shows values from 30328.283616935427 to 296385.92008210334.