Edit chart
Loading graph
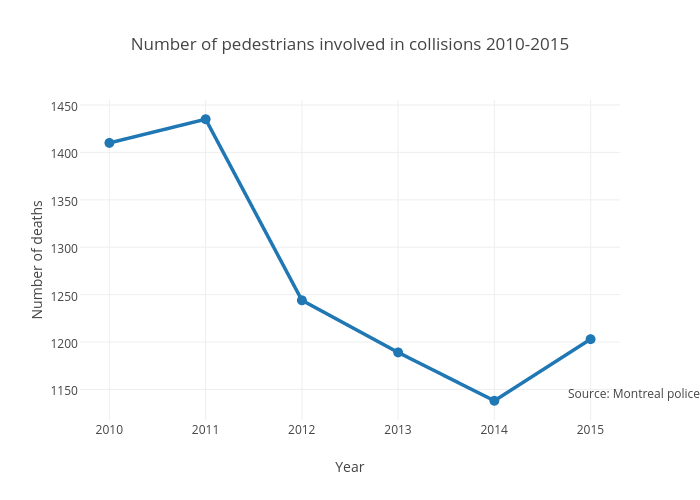
Jasonmagder77bd's interactive graph and data of "Number of pedestrians involved in collisions 2010-2015" is a line chart, showing B; with Year in the x-axis and Number of deaths in the y-axis.. The x-axis shows values from 2009.6943686828172 to 2015.3056313171828. The y-axis shows values from 1117.7252928257687 to 1455.274707174231. This visualization has the following annotation: Source: Montreal police