Edit chart
Loading graph
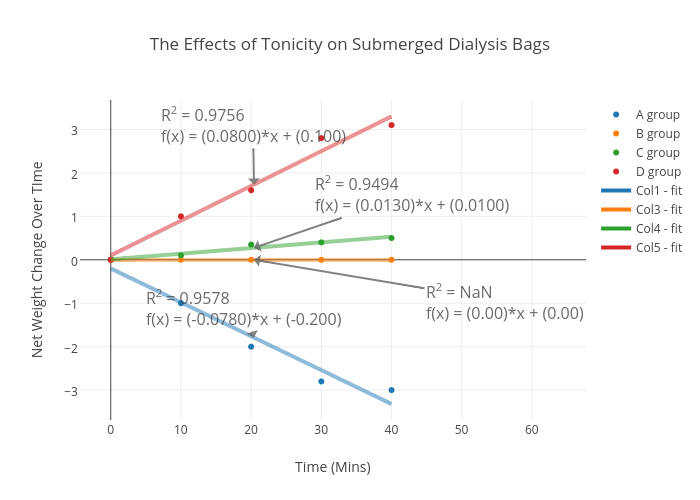
Jelara's interactive graph and data of "The Effects of Tonicity on Submerged Dialysis Bags" is a scatter chart, showing A group, B group, C group, D group, Col1 - fit, Col3 - fit, Col4 - fit, Col5 - fit; with Time (Mins) in the x-axis and Net Weight Change Over TIme in the y-axis.. The x-axis shows values from -2.4255734504636415 to 42.425573450463645. The y-axis shows values from -3.687777777777783 to 3.6677777777778964. This visualization has the following annotations: R2 = 0.9578f(x) = (-0.0780)*x + (-0.200); R2 = NaNf(x) = (0.00)*x + (0.00); R2 = 0.9494f(x) = (0.0130)*x + (0.0100); R2 = 0.9756f(x) = (0.0800)*x + (0.100)