Edit chart
Loading graph
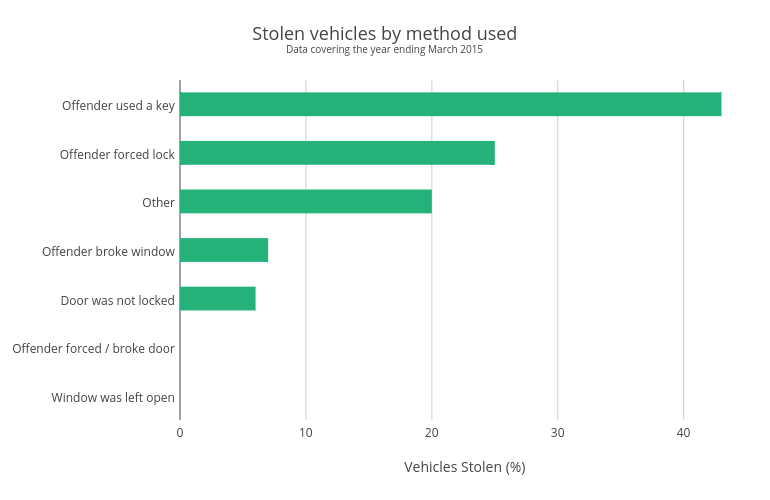
Jellyfishseo's interactive graph and data of "Stolen vehicles by method used" is a bar chart, showing Col2; with Vehicles Stolen (%) in the x-axis. The x-axis shows values from 0 to 45.26315789473684. The y-axis shows values from 6.5 to -0.5. This visualization has the following annotation: Data covering the year ending March 2015