Edit chart
Loading graph
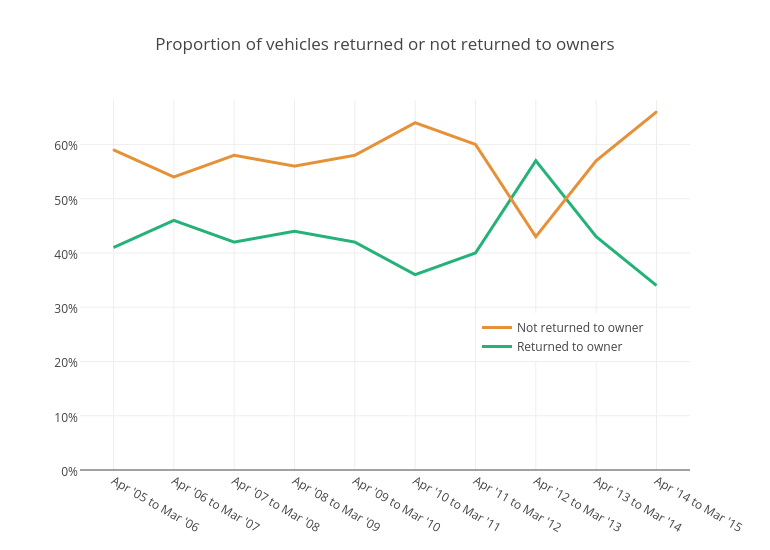
Jellyfishseo's interactive graph and data of "Proportion of vehicles returned or not returned to owners" is a scatter chart, showing Returned to owner vs Not returned to owner. The x-axis shows values from -0.5552486187845304 to 9.55524861878453. The y-axis shows values from 0 to 68.18740399385561.