Edit chart
Loading graph
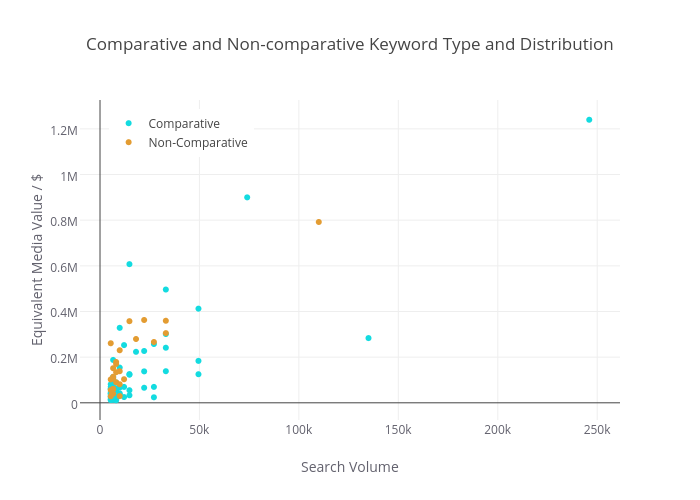
Jonoalderson's interactive graph and data of "Comparative and Non-comparative Keyword Type and Distribution" is a scatter chart, showing Comparative vs Non-Comparative; with Search Volume in the x-axis and Equivalent Media Value / $ in the y-axis.. The x-axis shows values from -8780.516317584023 to 260180.51631758403. The y-axis shows values from -66860.22636103151 to 1317878.2263610314.