Edit chart
Loading graph
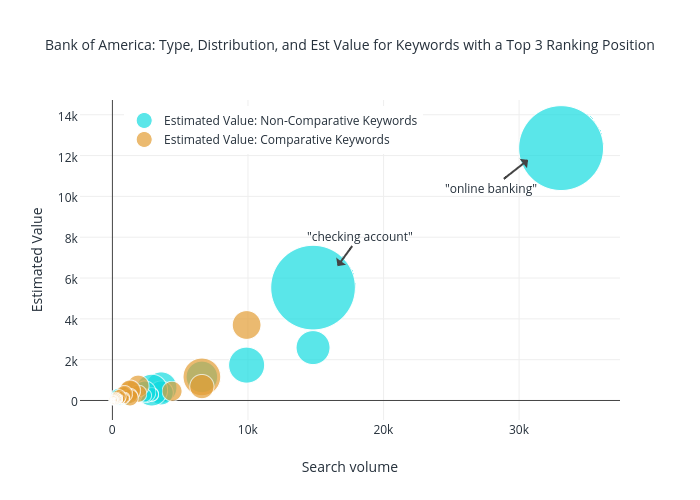
Jonoalderson's interactive graph and data of "Bank of America: Type, Distribution, and Est Value for Keywords with a Top 3 Ranking Position" is a scatter chart, showing Estimated Value: Non-Comparative Keywords vs Estimated Value: Comparative Keywords; with Search volume in the x-axis and Estimated Value in the y-axis.. The x-axis shows values from -2391.1990892531912 to 37443.919406951754. The y-axis shows values from -956.6264050469852 to 14723.46066606535. This visualization has the following annotations: "checking account"; "online banking"