Edit chart
Loading graph
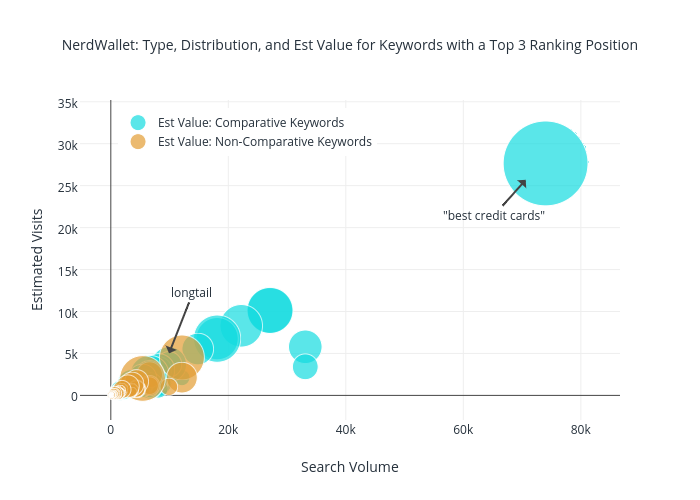
Jonoalderson's interactive graph and data of "NerdWallet: Type, Distribution, and Est Value for Keywords with a Top 3 Ranking Position" is a scatter chart, showing Est Value: Comparative Keywords vs Est Value: Non-Comparative Keywords; with Search Volume in the x-axis and Estimated Visits in the y-axis.. The x-axis shows values from -4461.6412424822765 to 81237.03643181272. The y-axis shows values from -1914.657415054416 to 32080.917191016186. This visualization has the following annotations: "best credit cards"; longtail