Edit chart
Loading graph
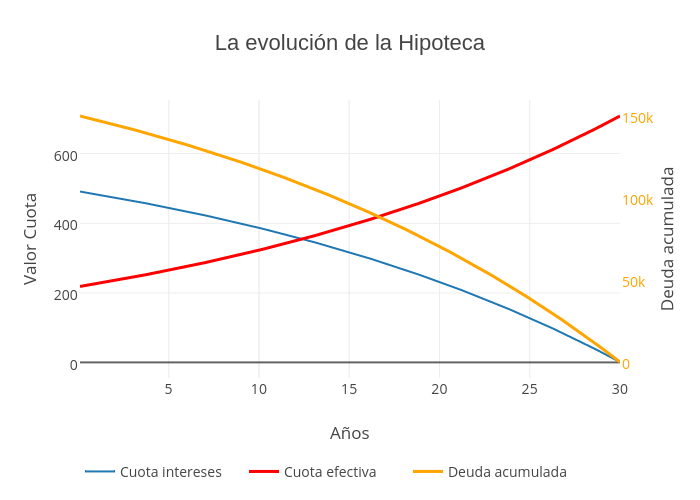
Jordiolle's interactive graph and data of "La evolución de la Hipoteca" is a scatter chart, showing Cuota intereses, Cuota efectiva, Deuda acumulada; with Años in the x-axis and Valor Cuota in the y-axis.. The x-axis shows values from 0.0833333333333333 to 30. The y-axis shows values from -36.867793800466615 to 746.8204043343646.