Edit chart
Loading graph
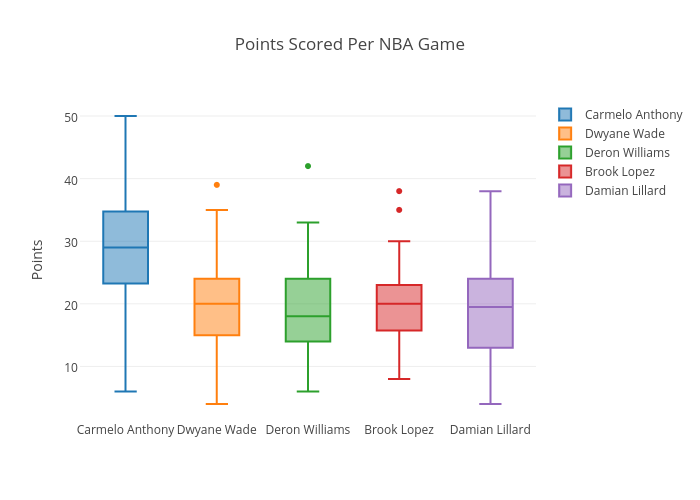
Jordiolle's interactive graph and data of "Points Scored Per NBA Game" is a box plot, showing Carmelo Anthony, Dwyane Wade, Deron Williams, Brook Lopez, Damian Lillard; with Points in the y-axis. The x-axis shows values from -0.5 to 4.5. The y-axis shows values from 1.4444444444444464 to 52.55555555555556.