Edit chart
Loading graph
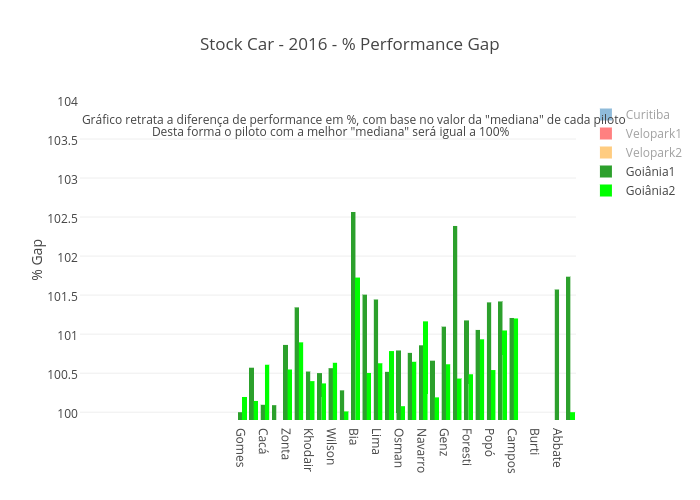
Josean's interactive graph and data of "Stock Car - 2016 - % Performance Gap" is a bar chart, showing Curitiba, Velopark1, Velopark2, Goiânia1, Goiânia2; with % Gap in the y-axis. The x-axis shows values from -0.5 to 29.5. The y-axis shows values from 99.9 to 104. This visualization has the following annotations: Gráfico retrata a diferença de performance em %, com base no valor da "mediana" de cada piloto; Desta forma o piloto com a melhor "mediana" será igual a 100%