Edit chart
Loading graph
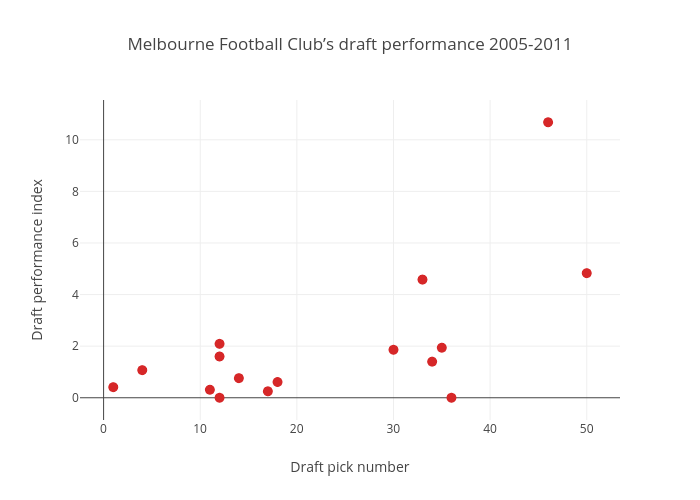
Joshnicholas's interactive graph and data of "Melbourne Football Club’s draft performance 2005-2011" is a scatter chart, showing DPI; with Draft pick number in the x-axis and Draft performance index in the y-axis.. The x-axis shows values from -2.2898248540450377 to 53.28982485404504. The y-axis shows values from -0.8896444266879745 to 11.569644426687974.