Edit chart
Loading graph
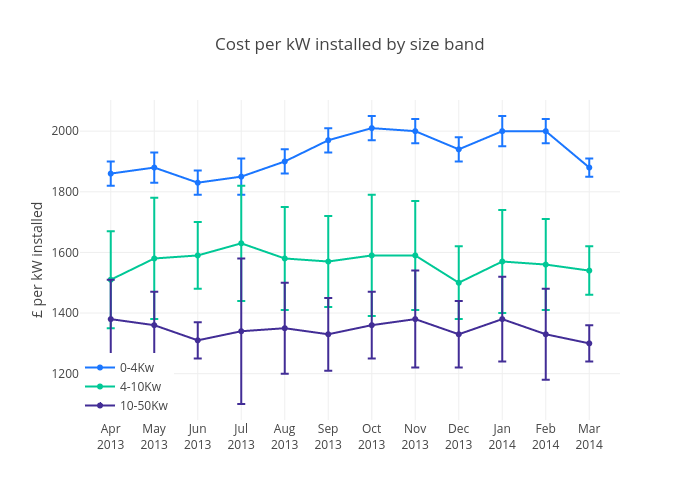
Justglowing's interactive graph and data of "Cost per kW installed by size band" is a scatter chartwith vertical error bars, showing 0-4Kw, 4-10Kw, 10-50Kw; with £ per kW installed in the y-axis. The x-axis shows values from 0 to 0. The y-axis shows values from 0 to 0.