Edit chart
Loading graph
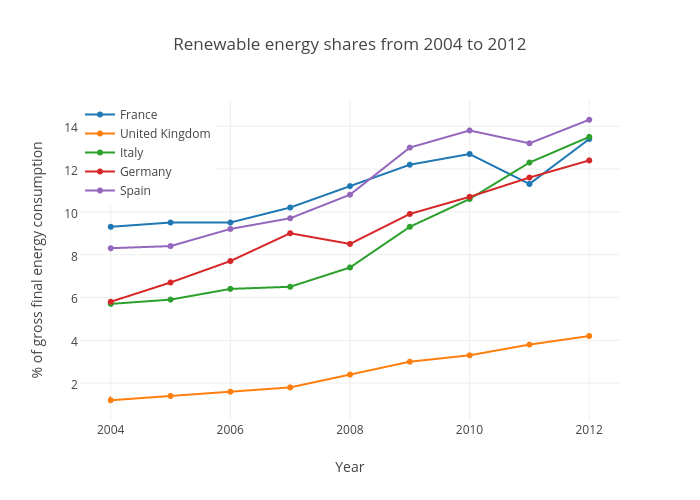
Justglowing's interactive graph and data of "Renewable energy shares from 2004 to 2012" is a scatter chart, showing France, United Kingdom, Italy, Germany, Spain; with Year in the x-axis and % of gross final energy consumption in the y-axis.. The x-axis shows values from 0 to 0. The y-axis shows values from 0 to 0.