Edit chart
Loading graph
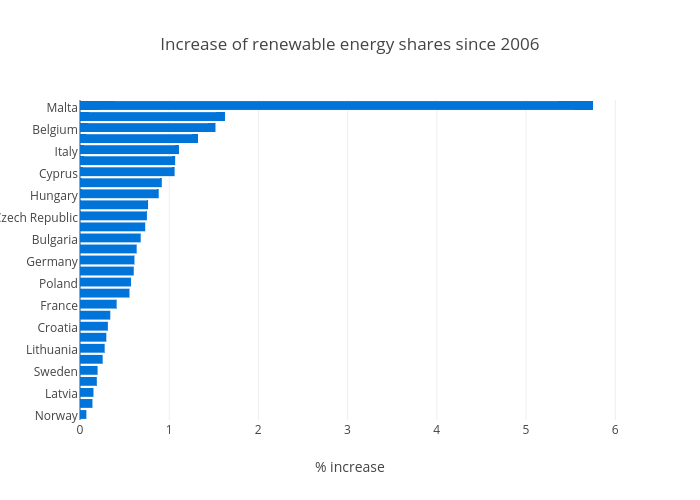
Justglowing's interactive graph and data of "Increase of renewable energy shares since 2006" is a bar chart, showing shares in 2012; with % increase in the x-axis. The x-axis shows values from 0 to 0. The y-axis shows values from 0 to 0.