Edit chart
Loading graph
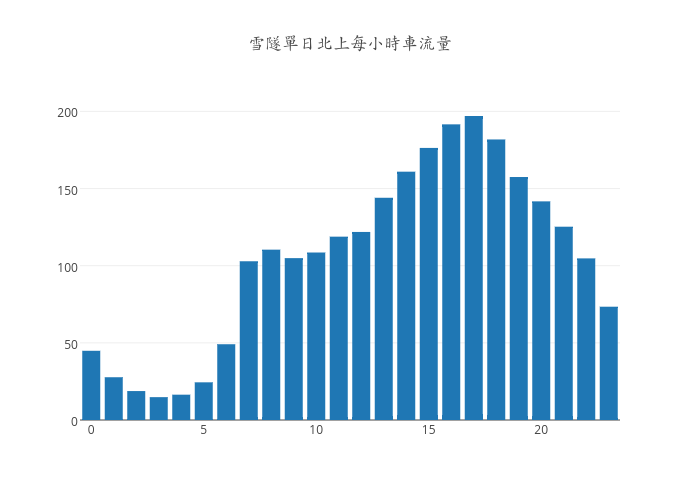
Karllin's interactive graph and data of "雪隧單日北上每小時車流量" is a bar chart, showing Col3. The x-axis shows values from -0.5 to 23.5. The y-axis shows values from 0 to 207.35364726315788.