Edit chart
Loading graph
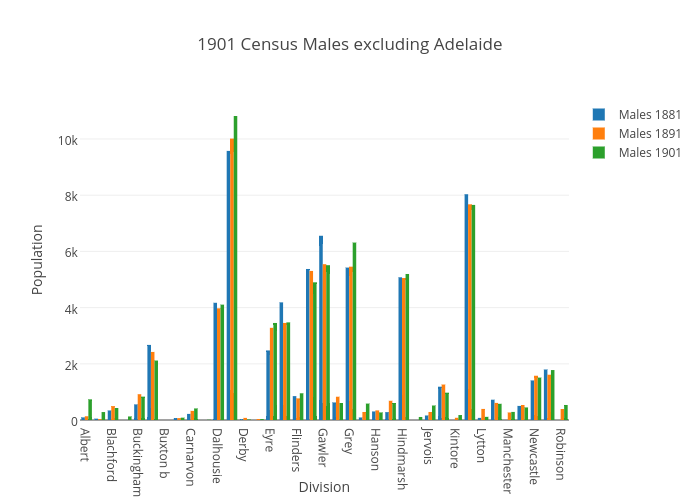
Katie110's interactive graph and data of "1901 Census Males excluding Adelaide" is a bar chart, showing Males 1881, Males 1891, Males 1901; with Division in the x-axis and Population in the y-axis.. The x-axis shows values from -0.5 to 36.5. The y-axis shows values from 0 to 11387.368421052632.