Edit chart
Loading graph
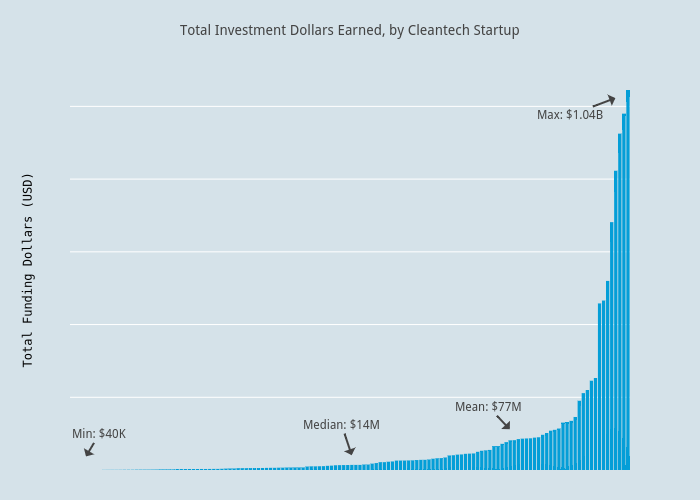
Katie_straub's interactive graph and data of "Total Investment Dollars Earned, by Cleantech Startup" is a bar chart, showing Col2; with Total Funding Dollars (USD) in the y-axis. The x-axis shows values from -1.984322584544703 to 135.5. The y-axis shows values from 0 to 1100042105.2631578. This visualization has the following annotations: Mean: $77M; Median: $14M; Max: $1.04B; Min: $40K