Edit chart
Loading graph
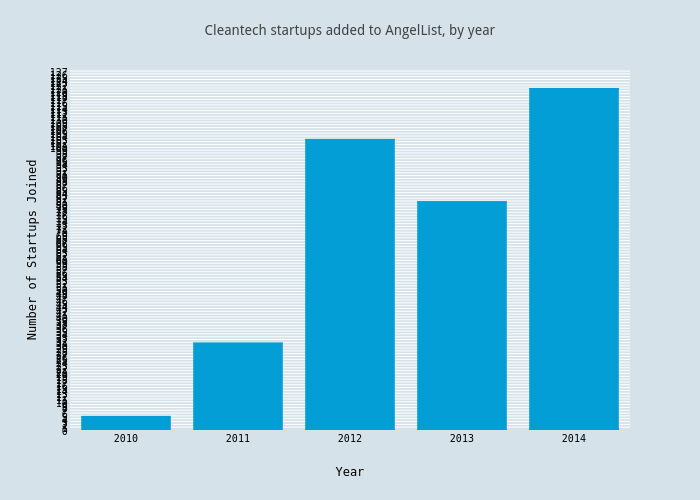
Katie_straub's interactive graph and data of "Cleantech startups added to AngelList, by year" is a bar chart, showing Col2; with Year in the x-axis and Number of Startups Joined in the y-axis.. The x-axis shows values from 2009.5 to 2014.5. The y-axis shows values from 0 to 127.36842105263158.