Edit chart
Loading graph
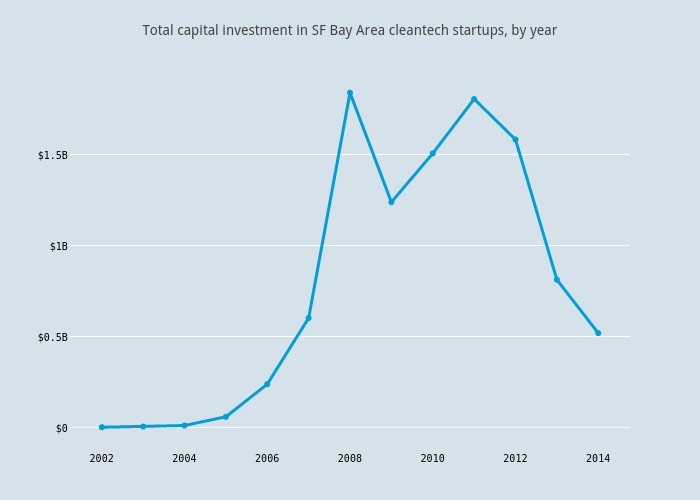
Katie_straub's interactive graph and data of "Total capital investment in SF Bay Area cleantech startups, by year" is a scatter chart, showing Col2. The x-axis shows values from 2001.2432432432433 to 2014.7567567567567. The y-axis shows values from -130195957.02353837 to 1970335057.0235384.