Edit chart
Loading graph
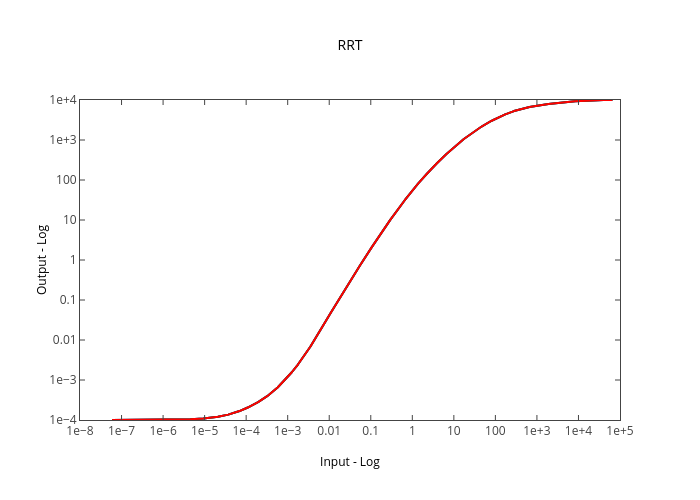
Kelsolaar's interactive graph and data of "RRT" is a line chart, showing R, G, B. The x-axis shows values from 0 to 0. The y-axis shows values from 0 to 0.