Edit chart
Loading graph
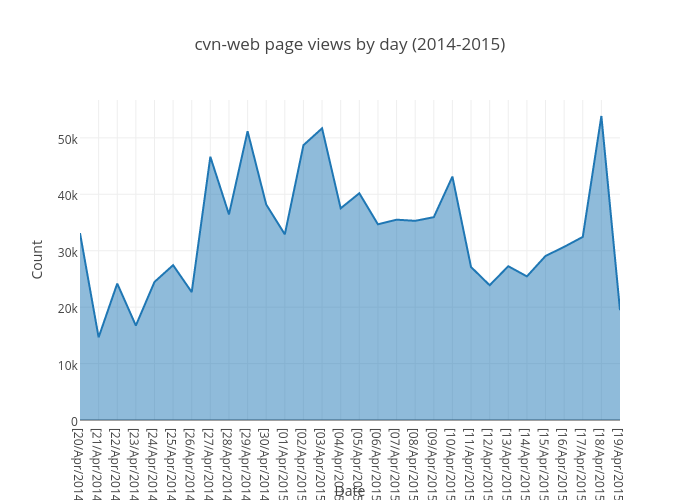
Krinkle's interactive graph and data of "cvn-web page views by day (2014-2015)" is a filled line chart, showing Count; with Date in the x-axis and Count in the y-axis.. The x-axis shows values from 0 to 29. The y-axis shows values from 0 to 56709.47368421053.