Edit chart
Loading graph
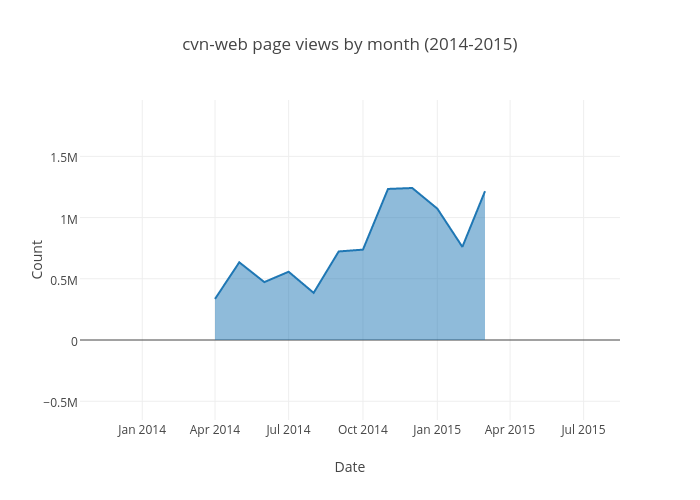
Krinkle's interactive graph and data of "cvn-web page views by month (2014-2015)" is a filled line chart, showing Count; with Date in the x-axis and Count in the y-axis.. The x-axis shows values from 1381876200000 to 1439598600000. The y-axis shows values from -653428.4210526317 to 1960285.2631578944.