Edit chart
Loading graph
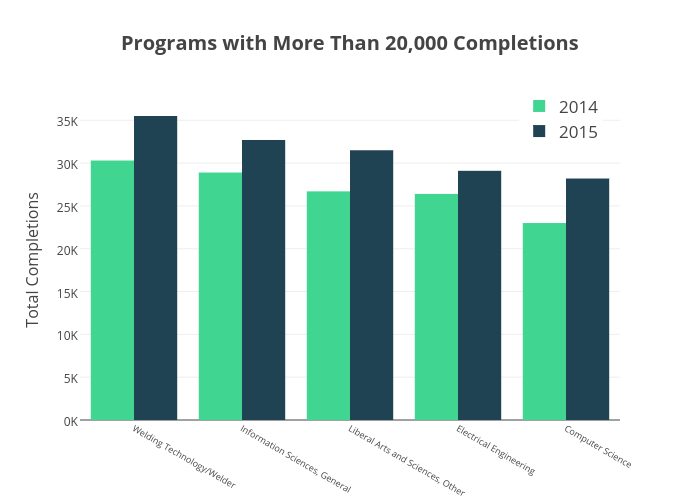
Krollins's interactive graph and data of "Programs with More Than 20,000 Completions" is a bar chart, showing 2014 vs 2015; with Total Completions in the y-axis. The x-axis shows values from -0.5 to 4.5. The y-axis shows values from 0 to 37.36842105263158.