Edit chart
Loading graph
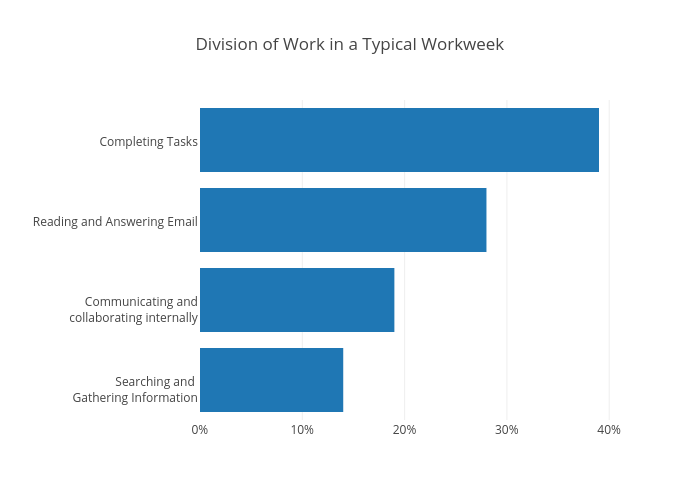
Mattsundquist's interactive graph and data of "Division of Work in a Typical Workweek" is a bar chart, showing Col2_% of Average Workweek, trace1_y, trace2_y. The x-axis shows values from 0 to 41.05263157894737. The y-axis shows values from -0.5 to 3.5.