Edit chart
Loading graph
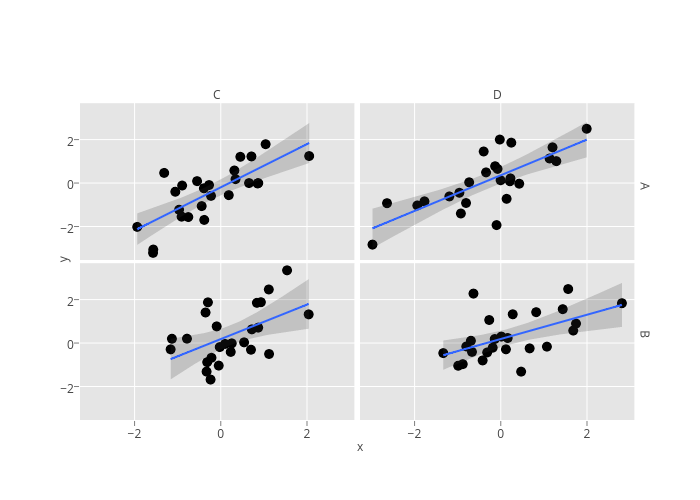
Mattsundquist's interactive graph and data of "None, None, None, None, None, None, None, None, None, None, None, None" is a scatter chart, showing None, None, None, None, None, None, None, None, None, None, None, None. The x-axis shows values from -3.2660290617253933 to 3.0998085262492494. The y-axis shows values from -3.5413415845128564 to 3.6747572335162926. This visualization has the following annotations: A; B; C; D; x; y