Edit chart
Loading graph
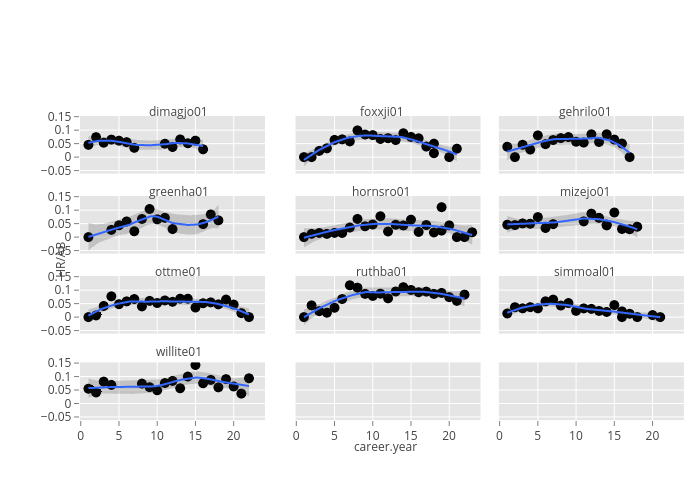
Mattsundquist's interactive graph and data of "None, None, None, None, None, None, None, None, None, None, None, None, None, None, None, None, None, None, None, None, None, None, None, None, None, None, None, None, None, None" is a scatter chart, showing None, None, None, None, None, None, None, None, None, None, None, None, None, None, None, None, None, None, None, None, None, None, None, None, None, None, None, None, None, None. The x-axis shows values from -0.10000000000000009 to 24.1. The y-axis shows values from -0.06123492697840685 to 0.15257581284931188. This visualization has the following annotations: dimagjo01; foxxji01; gehrilo01; greenha01; hornsro01; mizejo01; ottme01; ruthba01; simmoal01; willite01; career.year; HR/AB