Edit chart
Loading graph
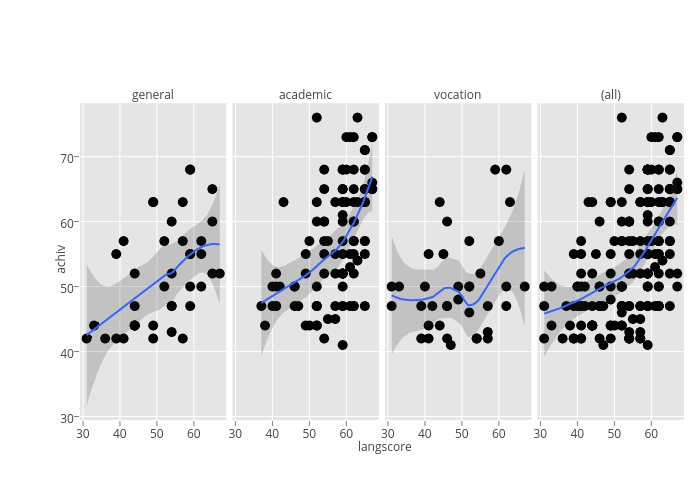
Mattsundquist's interactive graph and data of "None, None, None, None, None, None, None, None, None, None, None, None" is a scatter chart, showing None, None, None, None, None, None, None, None, None, None, None, None. The x-axis shows values from 29.2 to 68.8. The y-axis shows values from 29.460772498087493 to 78.21615369056727. This visualization has the following annotations: general; academic; vocation; (all); langscore; achiv