Edit chart
Loading graph
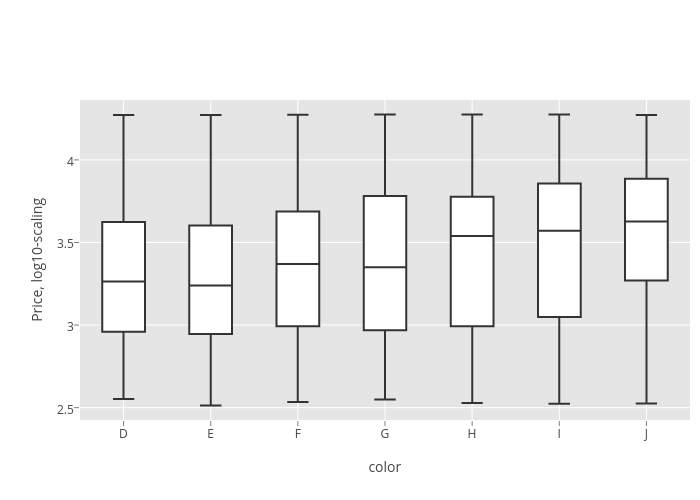
Mattsundquist's interactive graph and data of "Price, log10-scaling vs color" is a box plot, showing D, E, F, G, H, I, J; with color in the x-axis and Price, log10-scaling in the y-axis.. The x-axis shows values from 0 to 0. The y-axis shows values from 2.4251440379594578 to 4.362762404346039.