Edit chart
Loading graph
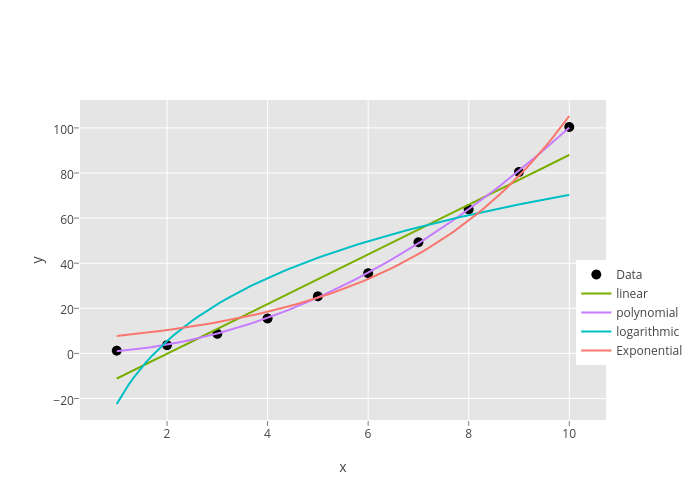
Mattsundquist's interactive graph and data of "y vs x" is a scatter chart, showing Data, linear, polynomial, logarithmic, Exponential; with x in the x-axis and y in the y-axis.. The x-axis shows values from 0.42344439000489953 to 10.5765556099951. The y-axis shows values from -29.53667483079176 to 112.37551470672493.