Edit chart
Loading graph
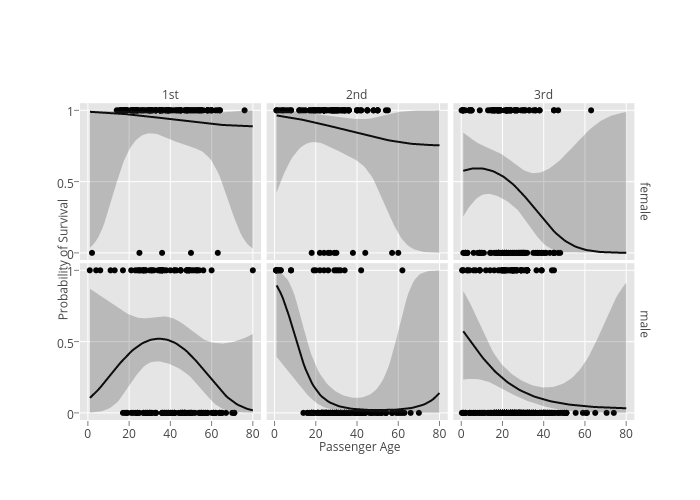
Mattsundquist's interactive graph and data of "None, None, None, None, None, None, None, None, None, None, None, None, None, None, None, None, None, None" is a scatter chart, showing None, None, None, None, None, None, None, None, None, None, None, None, None, None, None, None, None, None. The x-axis shows values from -3.8249649937 to 83.9916649997. The y-axis shows values from -0.05 to 1.05. This visualization has the following annotations: female; male; 1st; 2nd; 3rd; Passenger Age; Probability of Survival