Edit chart
Loading graph
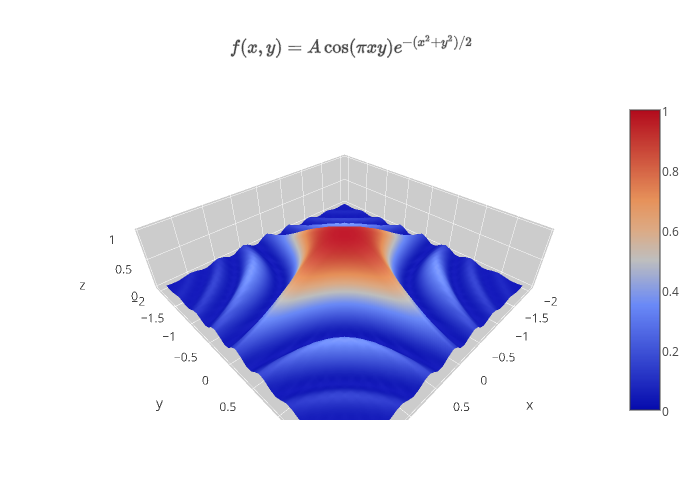
Mattsundquist's interactive graph and data of "$f(x,y) = A \cos(\pi x y) e^{-(x^2+y^2)/2}$" is a surface. The x-axis shows values from 0 to 0. The y-axis shows values from 0 to 0.