Edit chart
Loading graph
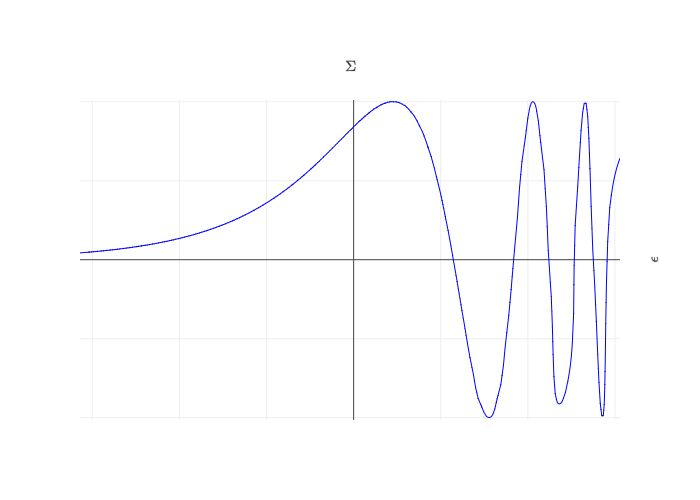
Mattsundquist's interactive graph and data of "$\epsilon$ vs $\Sigma$" is a scatter chart, showing trace 0; with $\Sigma$ in the x-axis and $\epsilon$ in the y-axis.. The x-axis shows values from -3.1415899999999994 to 3.05841. The y-axis shows values from -1.0149415497146181 to 1.0111494515222956.