Edit chart
Loading graph
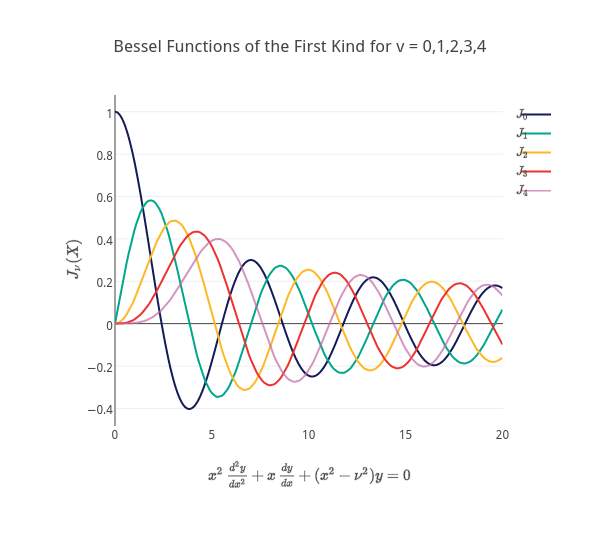
Mattsundquist's interactive graph and data of "Bessel Functions of the First Kind for v = 0,1,2,3,4" is a line chart, showing $J_0$, $J_1$, $J_2$, $J_3$, $J_4$; with $x^2 \frac{d^2 y}{dx^2} + x \frac{dy}{dx} + (x^2 - \nu^2)y = 0$ in the x-axis and $J_\nu(X)$ in the y-axis.. The x-axis shows values from 0 to 20. The y-axis shows values from -0.48047577777777783 to 1.0779197777777778.