Edit chart
Loading graph
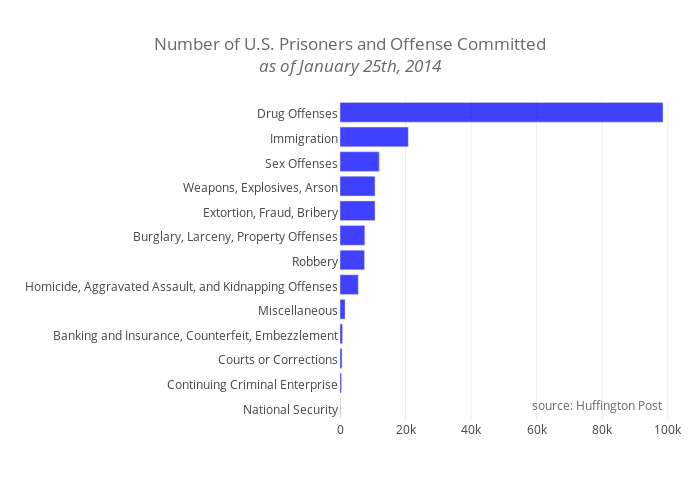
Mattsundquist's interactive graph and data of "Number of U.S. Prisoners and Offense Committedas of January 25th, 2014" is a bar chart, showing x. The x-axis shows values from 0 to 103741.05263157895. The y-axis shows values from -0.5 to 12.5. This visualization has the following annotation: source: Huffington Post