Edit chart
Loading graph
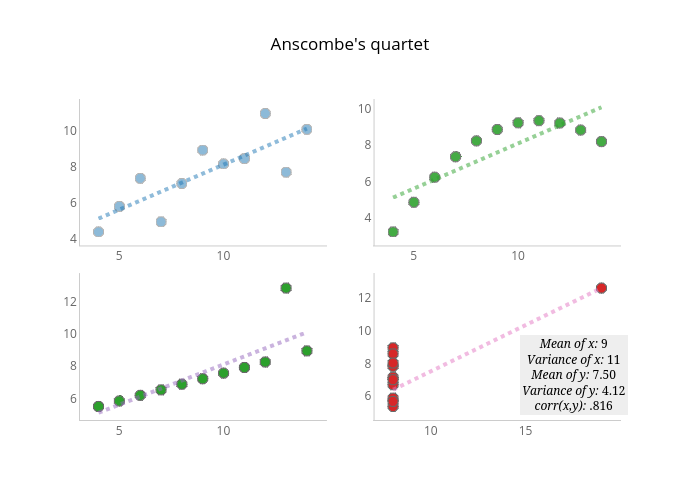
Mattsundquist's interactive graph and data of "Anscombe's quartet " is a scatter chart, showing Figure 1, Figure 2, Figure 3, Figure 4, fig 1 - fit, fig 2 - fit, fig 3 - fit, fig 4 - fit. The x-axis shows values from 3.2678839708771523 to 14.732116029122848. The y-axis shows values from 3.6846619365609348 to 11.415338063439066. This visualization has the following annotation: Mean of x: 9Variance of x: 11Mean of y: 7.50Variance of y: 4.12corr(x,y): .816