Edit chart
Loading graph
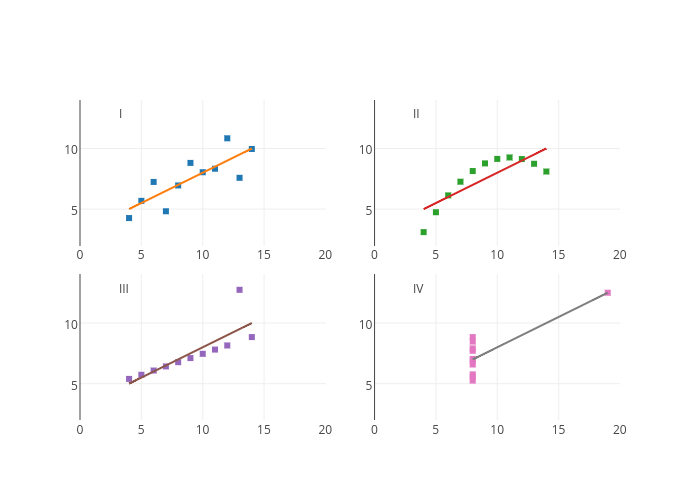
Mattsundquist's interactive graph and data of "_line0, _line1, _line0, _line1, _line0, _line1, _line0, _line1" is a scatter chart, showing _line0, _line1, _line0, _line1, _line0, _line1, _line0, _line1. The x-axis shows values from 0 to 0. The y-axis shows values from 0 to 0. This visualization has the following annotations: I; II; III; IV