Edit chart
Loading graph
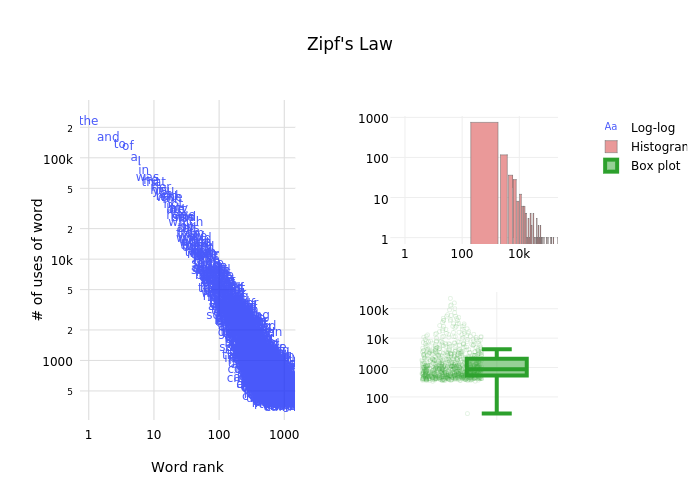
Mattsundquist's interactive graph and data of "Zipf's Law" is a , showing Log-log, Histogram, Box plot; with Word rank in the x-axis and # of uses of word in the y-axis.. The x-axis shows values from -0.1344847264330733 to 3.166208015349648. The y-axis shows values from 2.4121155105964607 to 5.570616604366322.