Edit chart
Loading graph
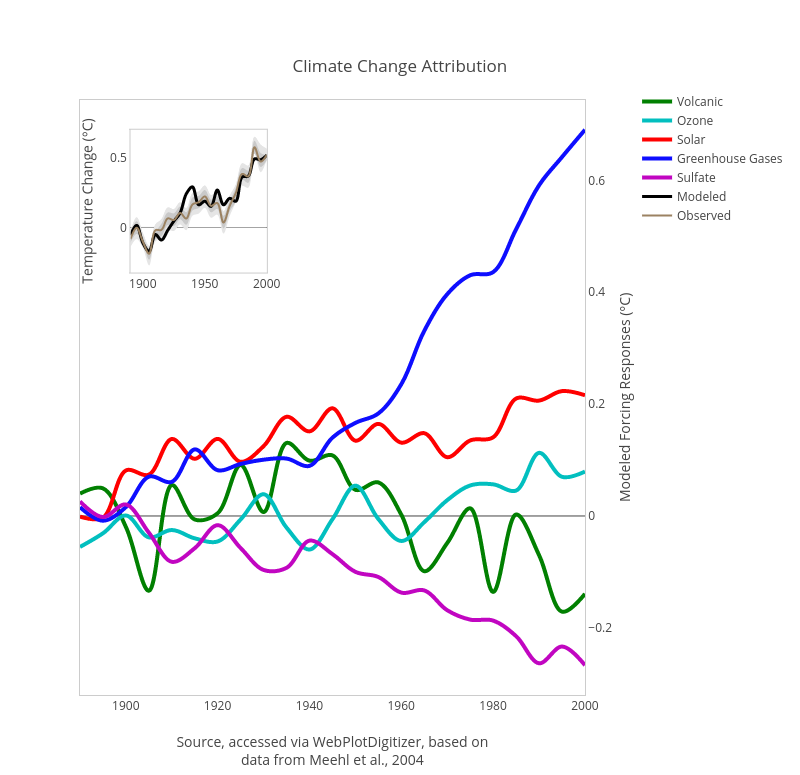
Mattsundquist's interactive graph and data of "Climate Change Attribution" is a scatter chart, showing Volcanic, Ozone, Solar, Greenhouse Gases, Sulfate, , , , , Modeled, Observed; with Source, accessed via WebPlotDigitizer, based ondata from Meehl et al., 2004 in the x-axis and Modeled Forcing Responses (°C) in the y-axis.. The x-axis shows values from -2524492800000 to 946713600000. The y-axis shows values from -0.3201243146943053 to 0.7438531191932106.