Edit chart
Loading graph
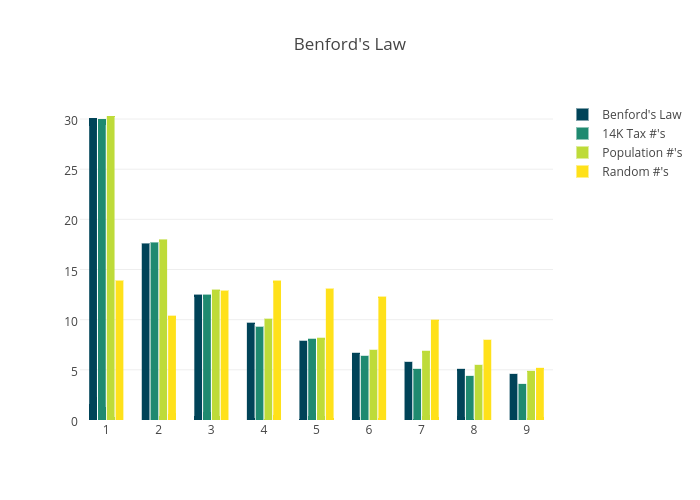
Mattsundquist's interactive graph and data of "Benford's Law" is a bar chart, showing Benford's Law, 14K Tax #'s, Population #'s, Random #'s. The x-axis shows values from 0.5 to 9.5. The y-axis shows values from 0 to 31.894736842105264.