Edit chart
Loading graph
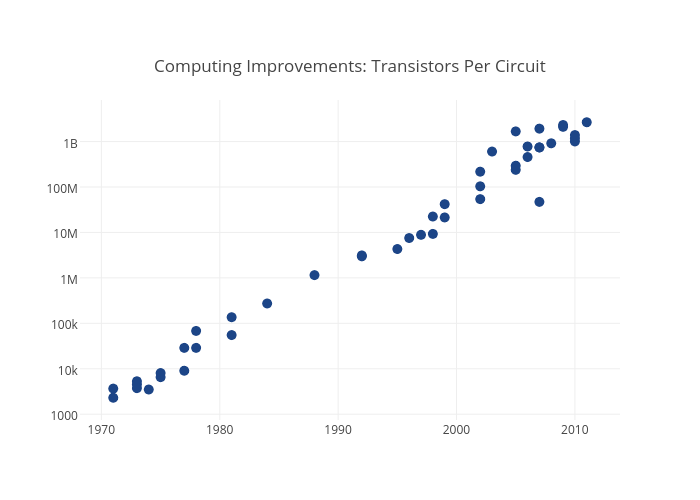
Mattsundquist's interactive graph and data of "Computing Improvements: Transistors Per Circuit" is a scatter chart, showing Transistors. The x-axis shows values from 1968.4329692154915 to 2013.5670307845085. The y-axis shows values from 2.880528660901307 to 9.906244479013811.