Edit chart
Loading graph
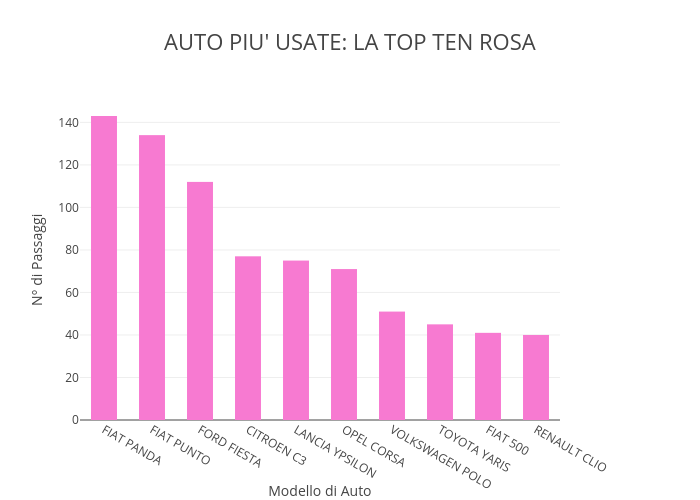
Micheleferrucci's interactive graph and data of "AUTO PIU' USATE: LA TOP TEN ROSA" is a bar chart, showing F; with Modello di Auto in the x-axis and N° di Passaggi in the y-axis.. The x-axis shows values from -0.5 to 9.5. The y-axis shows values from 0 to 150.52631578947367.