Edit chart
Loading graph
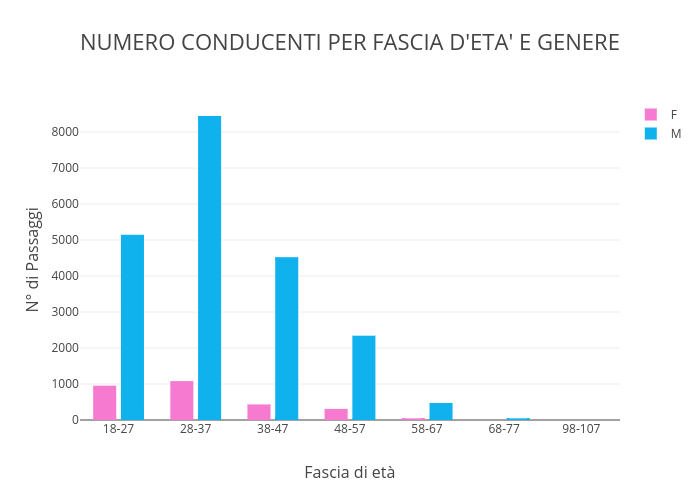
Micheleferrucci's interactive graph and data of "NUMERO CONDUCENTI PER FASCIA D'ETA' E GENERE" is a bar chart, showing F vs M; with Fascia di età in the x-axis and N° di Passaggi in the y-axis.. The x-axis shows values from -0.5 to 6.5. The y-axis shows values from 0 to 8889.473684210527.