Edit chart
Loading graph
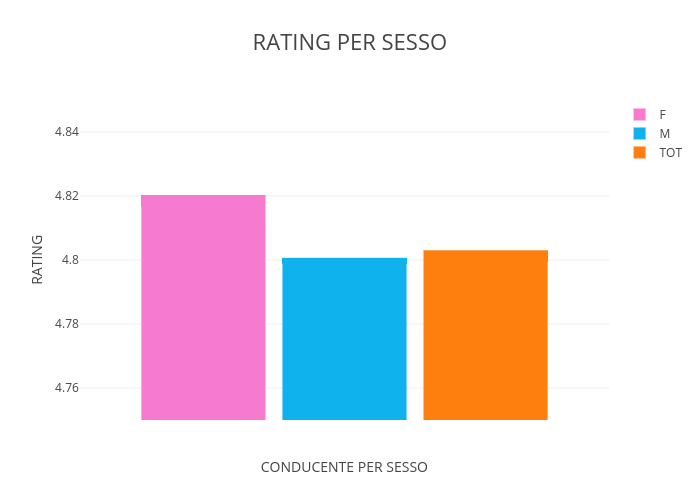
Micheleferrucci's interactive graph and data of "RATING PER SESSO" is a bar chart, showing F, M, TOT; with CONDUCENTE PER SESSO in the x-axis and RATING in the y-axis.. The x-axis shows values from -0.5 to 0.5. The y-axis shows values from 4.75 to 4.85.