Edit chart
Loading graph
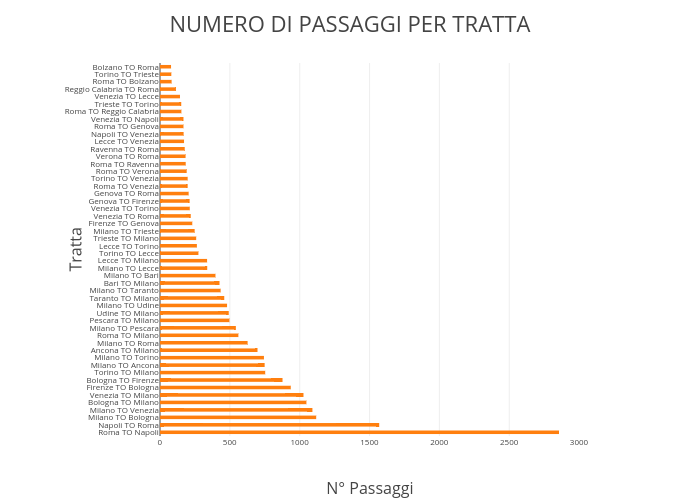
Micheleferrucci's interactive graph and data of "NUMERO DI PASSAGGI PER TRATTA" is a bar chart, showing N Passaggi; with N° Passaggi in the x-axis and Tratta in the y-axis.. The x-axis shows values from 0 to 3006.315789473684. The y-axis shows values from -0.5 to 49.5.