Edit chart
Loading graph
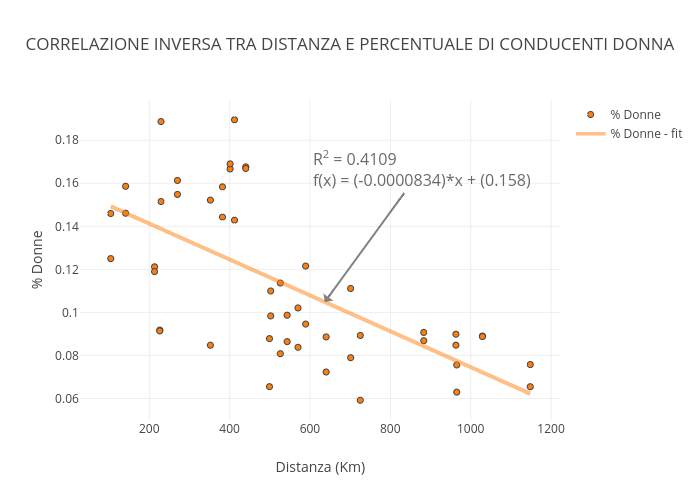
Micheleferrucci's interactive graph and data of "CORRELAZIONE INVERSA TRA DISTANZA E PERCENTUALE DI CONDUCENTI DONNA" is a scatter chart, showing % Donne vs % Donne - fit; with Distanza (Km) in the x-axis and % Donne in the y-axis.. The x-axis shows values from 37.50058616647128 to 1214.4994138335287. The y-axis shows values from 0.05048888070607144 to 0.19819884595932272. This visualization has the following annotation: R2 = 0.4109f(x) = (-0.0000834)*x + (0.158)